Fundraising Statistics Every Nonprofit Should Know
A big part of successful fundraising is understanding the current trends and knowing where to focus your efforts.
How can you best leverage fundraising trends to maximize your own results?
Part of this is keeping up-to-date with what’s happening in the fundraising world. Key data helps us to determine donor behavior and where we might make a difference. In this post, we’ve pulled together some of the most important statistics that every nonprofit should know. Use these to help you plan your campaigns this year:
Key Charitable Giving Statistics
The last couple of years have presented multiple challenges for most people, with the pandemic impacting upon their finances and other areas of their lives. However, the most recent Giving USA report reveals that individuals, bequests, foundations, and corporations gave an estimated $471.44 billion to U.S. charities in 2020. This is up 5.1% from total giving in 2019.
One important takeaway is that while times have been difficult, individuals and entities are still giving. In some cases, they’ve looked for ways to increase what they give to help out at a time they know is trying for many.
In analyzing key data, Amir Pasic, Ph.D., the Eugene R. Tempel Dean of the Lilly Family School of Philanthropy stated: “In some ways, 2020 is a story of uneven impact and uneven recovery. Many wealthier households were more insulated from the effects of COVID-19 and the ensuing economic shock, and they may have had a greater capacity to give charitably than households and communities that were disproportionately affected and struggled financially.”
Some key statistics include:
Individual giving
69% of the total amount given came from individuals. The total amount was $324.1 billion. This represents a growth of 2.2% in individual donations.
Foundation giving
19% of donations came from foundations. The total amount was $88.55 billion. This represents a growth of 17% in donations from foundations, the biggest percentage increase for a donor category. Foundations benefited from growth in the S&P 500, and market recovery. The conditions of the S&P 500 are traditionally closely linked with giving behavior.
Corporation giving
4% of donations came from corporations. The total amount was $16.88 billion. This is the only category in which there was a decrease in giving, down by 6.1% compared to the previous report. Corporate giving tends to be closely linked with GDP and pre-tax profits, both of which were down in 2020.
Bequests
9% of donations came from bequests. The total amount was $41.91 billion. This represents a growth of 10.3% in donations from bequests.
Demographic Fundraising Statistics
Which demographics are giving? Here are some key data points:
Age
- Millennials (born between 1981 and 1996) make up 25.9% of the US population. It’s important to note that contrary to popular rhetoric, the older segment of this generation are entering their forties.84% of millennials give to charity, averaging $481 annually, spread across 3.3 charities. 40% of millennials are enrolled in a monthly giving program. The average millennial salary is $47,034, although they also account for most of the nation’s renters and have more households in poverty than any other generation.Millennials are active on text messaging and social media, less likely to answer calls, and less likely to frequently check email.
- Gen X (born between 1965 and 1980) makes up 20.4% of the US population. They have similar levels of local volunteerism as millennials, at around 64%. 49% of Gen X donors make monthly charitable contributions. The average household income for Gen X is $113,445 as this is a generation in their prime earning period. However, Gen X also has more debt than other generations, averaging $136,000. They’re a generation that is often looking after children and elderly parents at the same time. Gen X prefers text messages or voice calls. They keep up with email and social media.
- Baby Boomers (born between 1946 and 1964) make up 23.6% of the US population. They are the most likely of all generations to attend fundraising events. 72% of all Baby Boomers give to charity, an average annual donation of $1212 across 4.5 organizations. 49% are enrolled in a monthly giving program. The average Baby Boomer household earns $78,508, while 66.9% of those aged 65-74 are retired. Baby Boomers answer the phone and text messages. 82.3% belong to at least one social media site.
- The Silent Generation (born between 1928 and 1945) makes up 11.8% of the US population. They represent 26% of total giving in the US. 88% of the Silent Generation give to charity, with an annual average of $1367 across 6.2 organizations. Their average household income is $41,508 with 86.7% of those over 75 being retired.The Silent Generation prefers voice calls and direct mail. They use text messaging, email, and social media much less frequently than younger generations.
Income level
The table below from the Tax Policy Center breaks down tax returns that claim charitable deductions by income group:
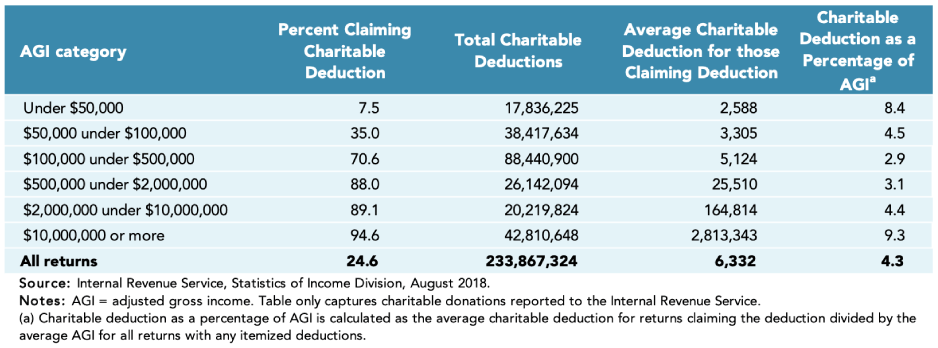
Some points that stand out include that those making less than $50,000 are the second-highest givers in terms of percentage of income, while those making between $100,000 and $500,000 donate the least as a percentage of income.
Location
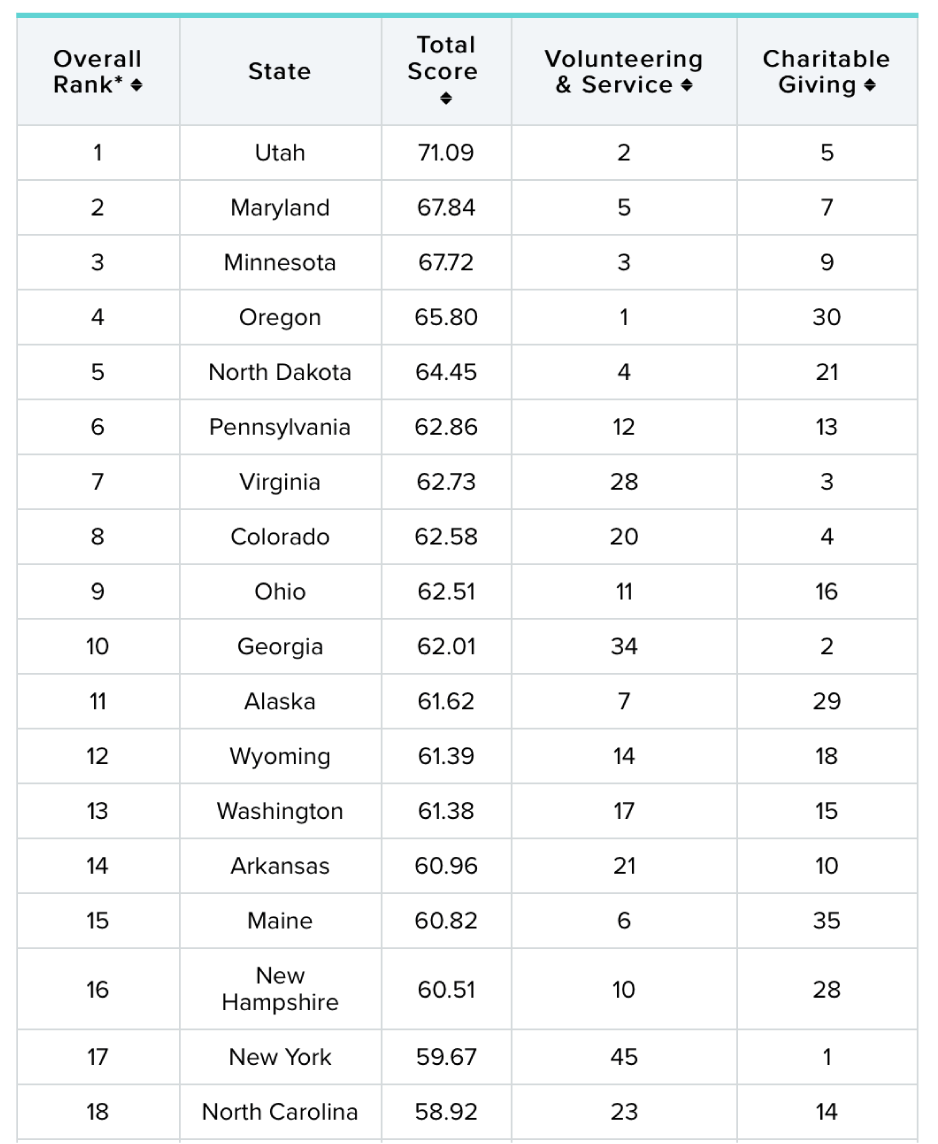
Wallethub has created a ranking table of the “most charitable states,” factoring in both volunteering and charitable donations. It’s worth looking at more closely – for example, some states rank lower because they have much less volunteer time given than others, even if their charitable giving is up. California is an example, coming in at 39th overall by ranking 50th for volunteering, yet 8th for charitable giving.
Corporate Giving and Matching Gifts Fundraising Statistics
Corporate giving is usually motivated by both altruism and benefits to the company, including public image and tax benefits. Overall last year, corporate giving was down, in line with lower GDP and before-tax profits.
Last year, corporate giving was specifically bolstered by $405 million in contributions related to disaster relief. In terms of giving and matching, 79% of companies reported increased donor participation rates and 73% raised more money. 90% offered a matching gift program. Technology companies gave the highest proportion of matching-gift contributions as a percentage of total cash gifts at 17.3%.
Corporate giving is most likely to focus on nonprofits that operate where they are located, particularly if they support improving the quality of life there. They also support causes that their own employees favor with their volunteer time and charitable giving.
Corporations tend to look for charitable partners that enhance their brand, with 90% indicating they believe partnering will improve their image. Another known benefit for corporations is that making charitable contributions is something employees overwhelmingly want. Employees who engage with the corporate giving program tend to have 75% longer tenure with the company.
Education/School-Based Fundraising Statistics
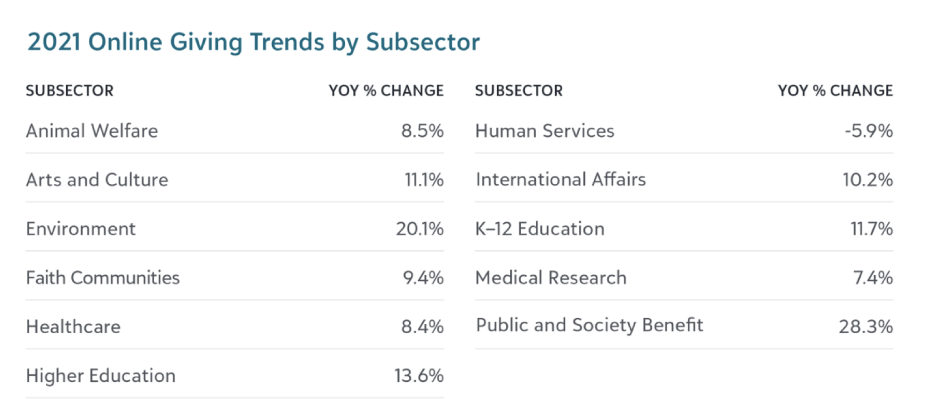
According to the Blackbaud Institute, both higher education and K-12 education fare well in online giving, up by 13.6% and 11.7% respectively. Higher education has been enjoying a three-year rolling trend of a 58.6% increase in overall donations. A table summarizing online giving is shown below:
Overall, giving to education as a broad category is estimated to have increased by 9%, which includes K-12, higher education, and libraries. $71 billion went to this category as a whole.
Religious/Faith-Based Fundraising Statistics
Giving to religious or faith-based organizations grew by 1% between 2019 and 2020. When adjusted for inflation, this shows a flattening trend for giving within this category. The total contributions were $131.08 billion.
In terms of church giving, only 3-5% of Americans who give to churches do so by regular tithing. 17% of American families have reduced the amount they give to local churches, while 37% of regular church attendees don’t give money to the church.
In terms of overall religious giving, Jewish people give the most, averaging $2526 annually. This is followed by Protestants on $1749, Muslims on $1178, and Catholics on $1142. Jewish and Muslim donors were more likely to donate to social and human rights organizations. Christian donation choices tend to vary by denomination.
Meanwhile, 75% of people who don’t go to church make donations to nonprofit organizations.
Fundraising Statistics – Key trends
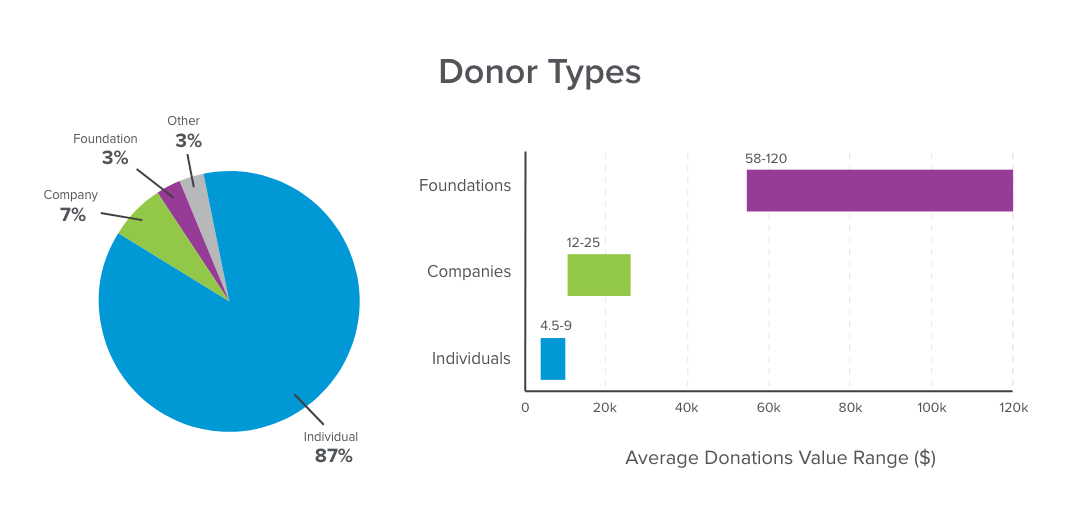
How does fundraising vary according to donor types?

- Individual donors are the most common donor type, accounting for 87% of all donations.
- Companies make up only 7% of donations, while foundations and other types contribute the remaining 3%.
- Donations from individuals range from $4500 to $9000, with companies typically donating between $12000 to $25000.
- Foundations tend to make the largest donations, with their contributions ranging from $58000 to $120000.
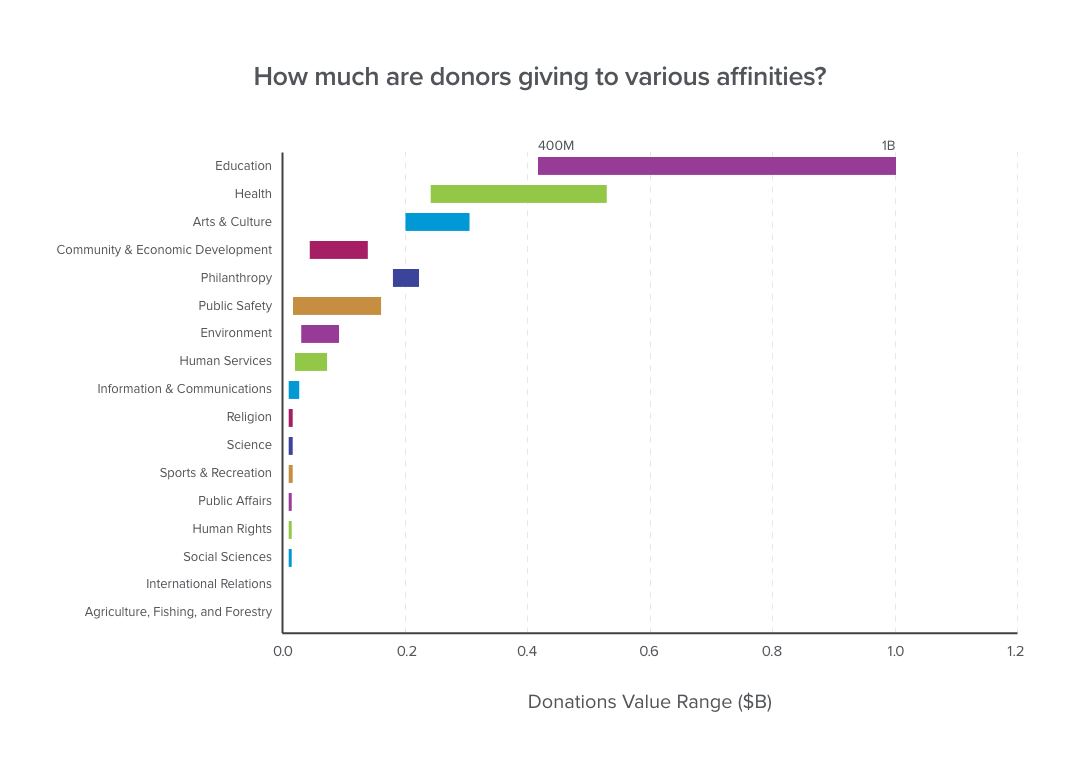
How much are donors giving to various affinities?

Donors are contributing generously to various affinity groups, with education being the top recipient of donations ranging from 400m to 1b USD. Health and arts and culture follow close behind, receiving annual donations ranging from 225m to 550m USD and 225m to 350m USD, respectively. While community and economic development, philanthropy, public safety, and the environment are also common affinities, the donation ranges for these causes vary depending on the affinity.
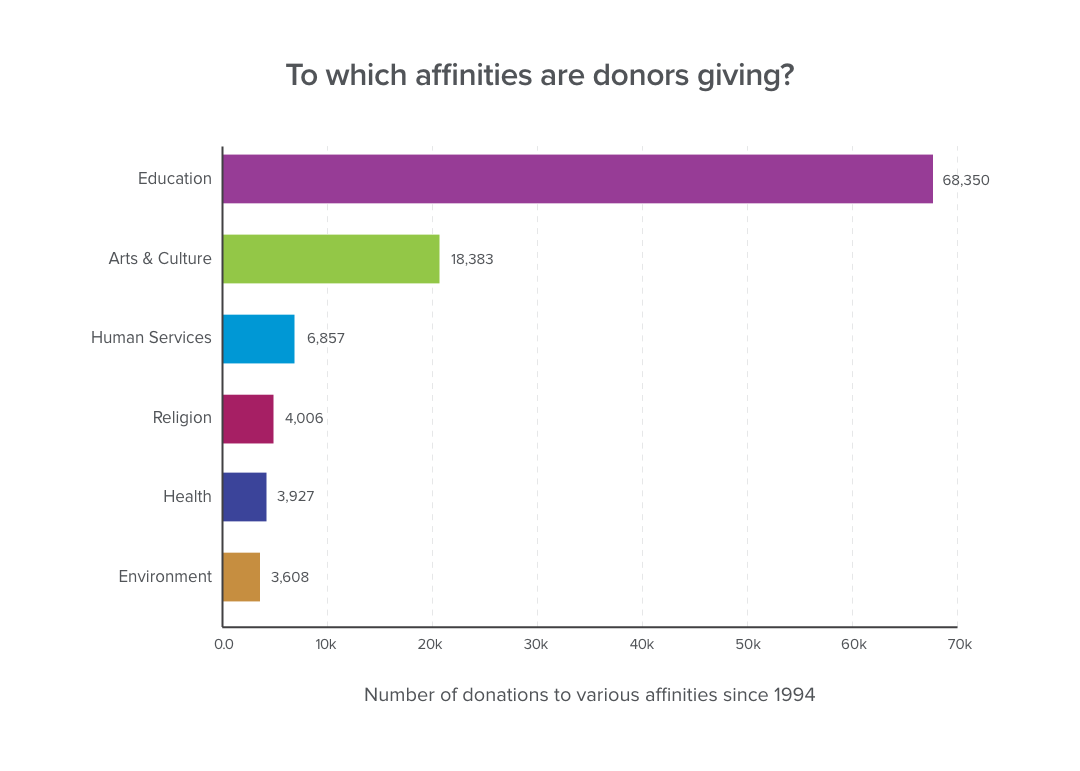
Which affinities attract the maximum number of donations?
Donations are flowing to various affinity groups, with education receiving the most significant number of donations at 68,350 since 1994. Arts and culture follow in second place with 18,383 donations, while human services, religion, and health receive 6,857, 4,006, and 3,927 donations, respectively. Donations to the environment round out the list with 3,608 contributions.
Which states had the highest number of donations since 1994?
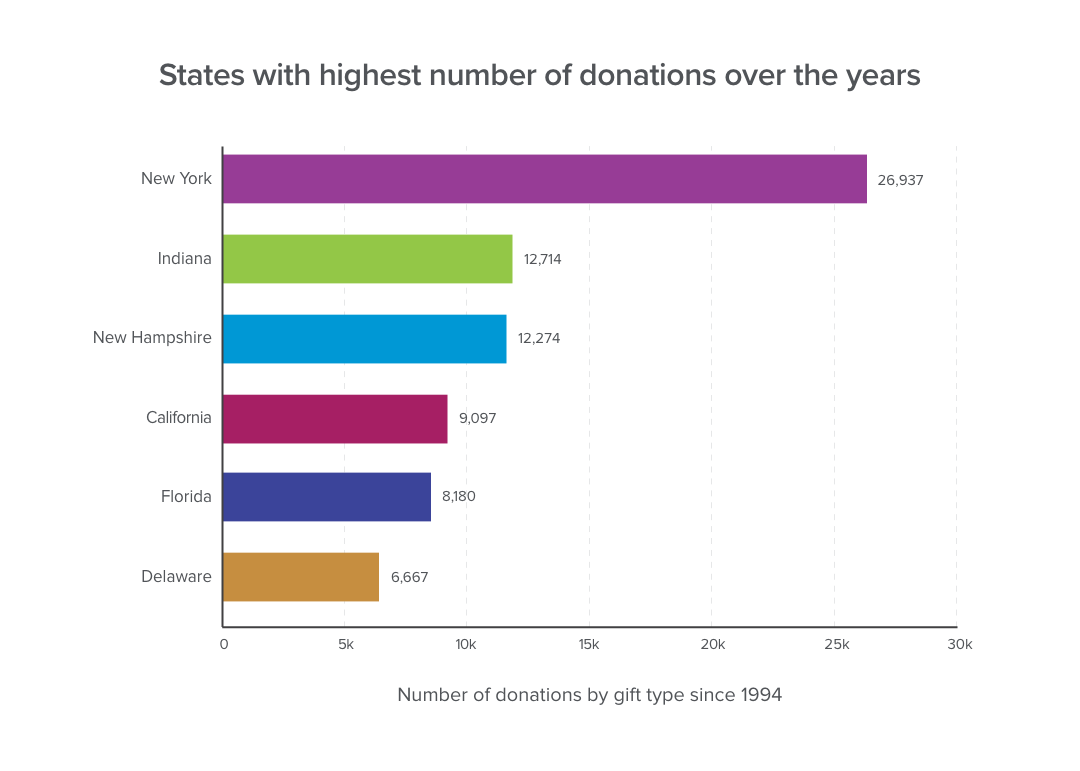
Donations have been made to various states across the country since 1994, with New York receiving the most significant number of contributions at 26,937. Indiana and New Hampshire follow closely behind with 12,714 and 12,274 donations, respectively. Other states that received a considerable number of donations include California with 9,097 donations, Florida with 8,180 donations, and Delaware with 6,667 donations.
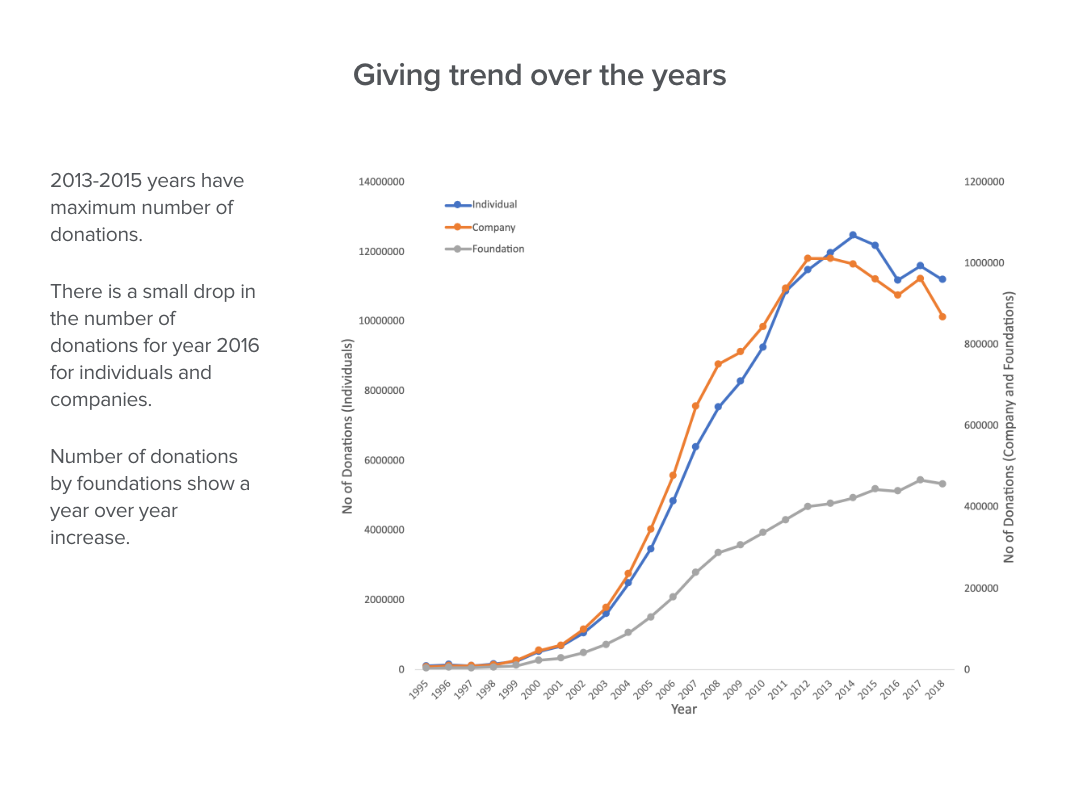
Fundraising trends since 1995:
Fundraising has generally been on a rise since 1995. Here is how the number of donations have progressed according to donor types.
The power of data for better fundraising campaigns
Understanding fundraising statistics is a powerful strategy for improving the overall success of your fundraising campaigns. Data analysis helps you to identify key donor groups and target your campaigns to appeal to them.
iWave has solutions to cater to all the key trends in the market, from leveraging affinity, to allowing you to get more information not only on individuals, but foundations and corporations, too. Use our fundraising intelligence platform to score potential donors and find the most likely people to approach.
You can request your free demo of iWave here.
Stay Up-to-date on Fundraising News and Resources
